The Adoption Curve Is a Lie
Over time, something broke in how we measure AI success from a core value perspective.
I see the same pattern every quarter: executive decks celebrating “green” adoption metrics while the actual projects are quietly dying in the background when it comes to business use and application. We are living in a moment where “success” and “failure” are being reported simultaneously, and both sides have receipts to back them up. Leaders are trying to add “value” more on paper than in real use cases, and it is a systemic problem from the top down.
Thanks for reading! Subscribe for free to receive new posts and support my work.
McKinsey reports that 78% of enterprises have adopted AI (do what you will with the term “adoption”). At the same time, industry benchmarks consistently show that 70-85% of AI projects fail to deliver meaningful value (there goes that term adoption!). MIT’s research on enterprise Generative AI found that a staggering 95% of implementations fail to achieve rapid revenue acceleration. S&P Global documented a year-over-year jump from 17% to 42% in abandoned AI initiatives.
These numbers don’t contradict each other. They reveal a core measurement crisis. We are counting the wrong thing because we are using the wrong guide.
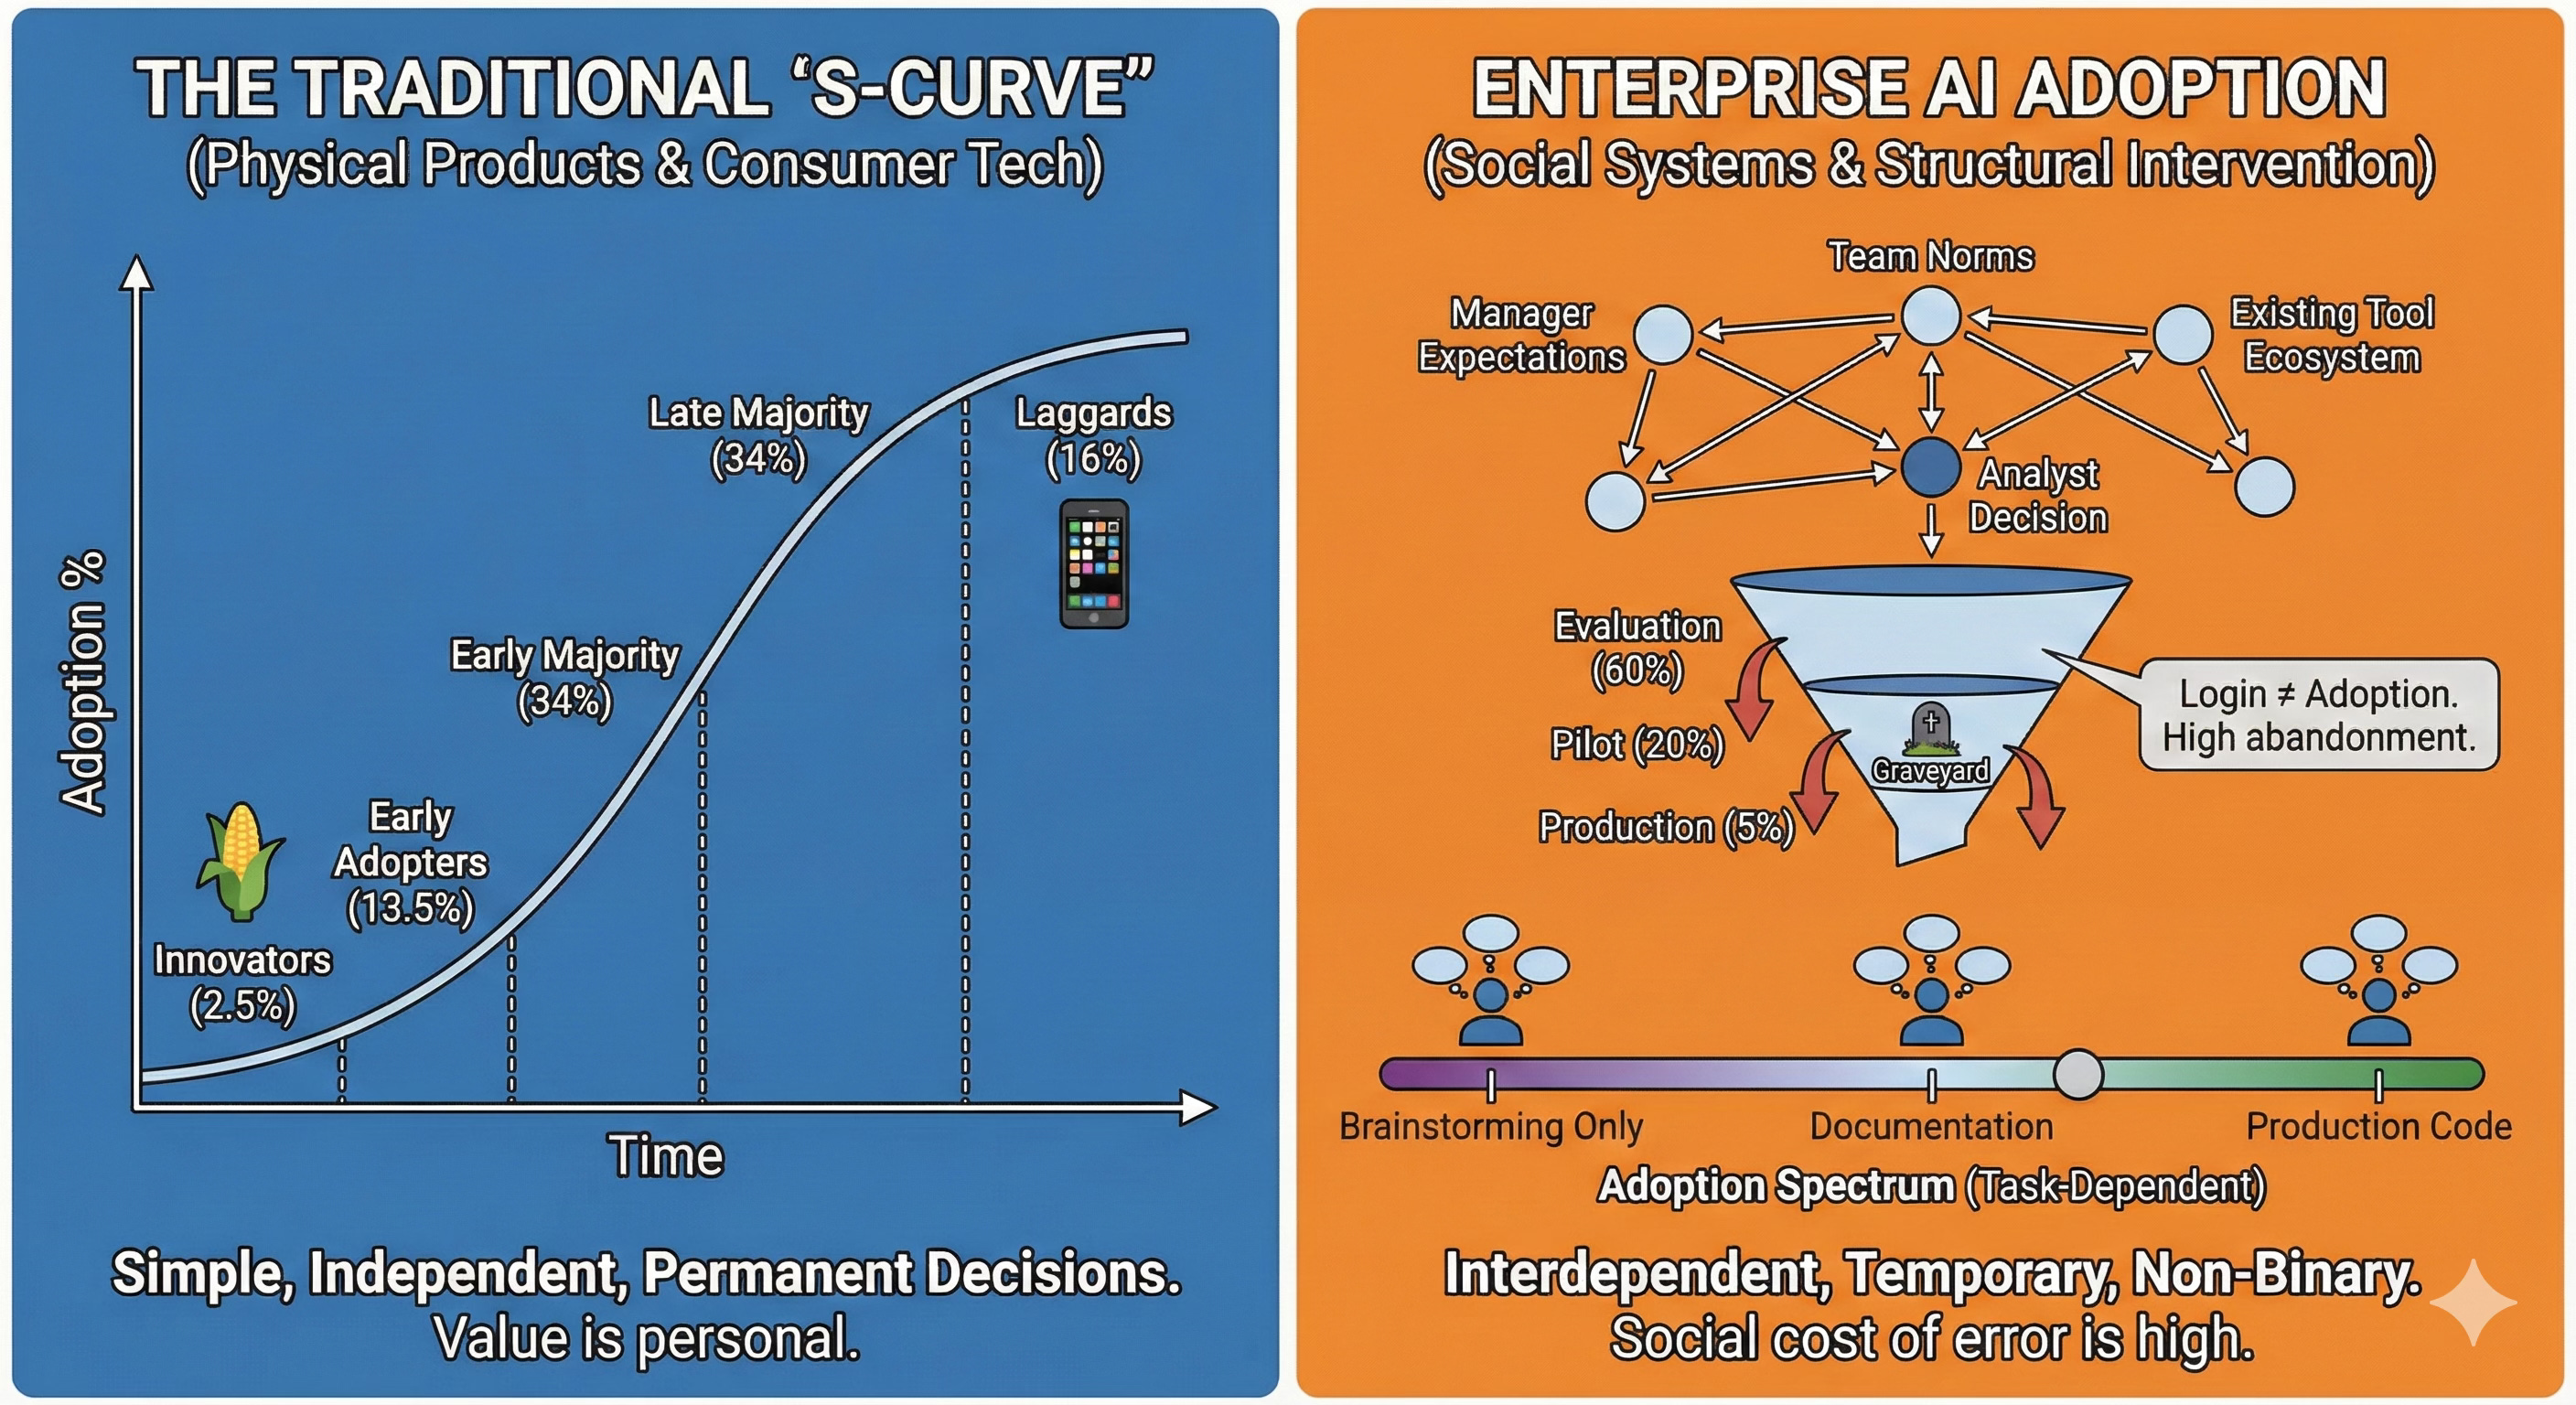
The adoption curve—that familiar S-curve showing early adopters leading to the early majority, then the late majority, and finally the laggards—was built for consumer products spreading through populations. It assumes individuals make independent decisions. It assumes that once a product is adopted, it stays adopted, leading it to fall into the norm. It assumes adoption is binary: you have it, or you don’t.
None of these hold true for enterprise AI. If you manage data products or lead AI transformation, relying on the S-curve isn’t just inaccurate—it’s a career risk.
The Curve Was Built for a Different Problem
The traditional adoption curve emerged from a 1943 study of how Iowa farmers adopted hybrid seed corn. It was a study of a physical product with a clear, one-time purchase decision. It worked great for consumer technology because the incentives were simple and clear. The iPhone spread through the population in a predictable wave because the value was personal and the decision was independent. Netflix displaced cable; Spotify replaced iTunes, etc., etc.
But enterprise AI is not a fancy gadget or the next wave of consumer technology. It is a structural intervention in a social system and in how people operate within it.
1. Decisions aren’t independent
In a company, no one adopts a tool in a vacuum. When an analyst considers using an AI assistant to write a Python script or summarize a quarterly report, they aren’t just weighing the tool’s utility. They are weighing manager expectations, team norms, and the existing tool ecosystem.
I have seen senior analysts avoid a functional AI tool because their director or VP made a skeptical comment about “hallucinations” in passing three months prior. In the enterprise, the social cost of being wrong with a new tool is often higher than the social cost of being slow with an old one. The adoption curve ignores this friction entirely.
2. Adoption isn’t permanent
The S-curve implies that once you cross the “chasm,” you’ve won. In enterprise AI, the graveyard isn’t at the beginning of the curve; it’s in the middle. MIT found that while 60% of organizations evaluated GenAI tools, only 20% reached the pilot stage—and just 5% reached production.
I’ve watched teams “adopt” a tool by logging in, completing the mandatory HR training, and updating their Slack status. Then they never opened it again. Why? Because the tool solved a problem the product team thought they had, but it created three new problems in their actual daily data intake process. The curve counts the login; it doesn’t count the abandonment that happens three days later.
3. Adoption isn’t binary
The question “Have they adopted AI?” is almost meaningless. I know data scientists who enthusiastically use LLMs for documentation but refuse to let them touch production code. I know marketing managers who use AI for brainstorming but wouldn’t dream of using it for budget forecasting or creating dashboards, reports, or deliverables.
Adoption exists on a spectrum that shifts daily based on task, context, and consequences. In the enterprise, the same user is an “early adopter” for one workflow and a “laggard” for another. If your metrics can’t capture that nuance, you’re flying blind.
Adoption Is a Daily Vote
Here is the reality of the work: every day, at every touchpoint in a workflow, your users are making micro-decisions. I call this the Daily Vote.
Should I use the AI tool to draft this stakeholder memo, or should I do it manually like I always have?
Do I trust this model’s output, or do I need to spend forty minutes double-checking the math anyway?
If I use the AI and there’s a mistake, am I the one who takes the heat?
These decisions compound. A tool that wins 70% of the daily votes becomes indispensable. A tool that wins just 40% gets left behind. This abandonment isn’t a dramatic “delete” event; it’s a slow fade into irrelevance. The manual path is often seen as “safer” or “more trusted,” even if it’s slower.
Traditional adoption metrics—active users, seat utilization, licenses assigned—capture the “first vote” (did they try it?) but miss every subsequent one. This is why you can have high adoption numbers and high failure rates simultaneously. Your dashboard says the seats are full, but the actual work is still happening in Excel.
This disconnect is highlighted in BearingPoint’s research, which found that 68% of organizations reported AI-led efficiency gains. On paper, they were successful. But the study also noted that middle managers struggle to allocate that “freed-up time” to higher-value activities.
This is the “Adoption Paradox.” The tool works, but the workflow didn’t actually change. People adopted the software without integrating the capability. The efficiency gains evaporate because nobody redesigned the work to account for the new speed.
A Better Way to Measure: Workflow Integration Depth
If the adoption curve fails here, we need a new lens. I suggest we stop measuring “adoption” and start measuring Workflow Integration Depth. This isn’t a single percentage point. It’s a five-level ladder that describes the relationship among the user, the tool, and the organization’s goals.
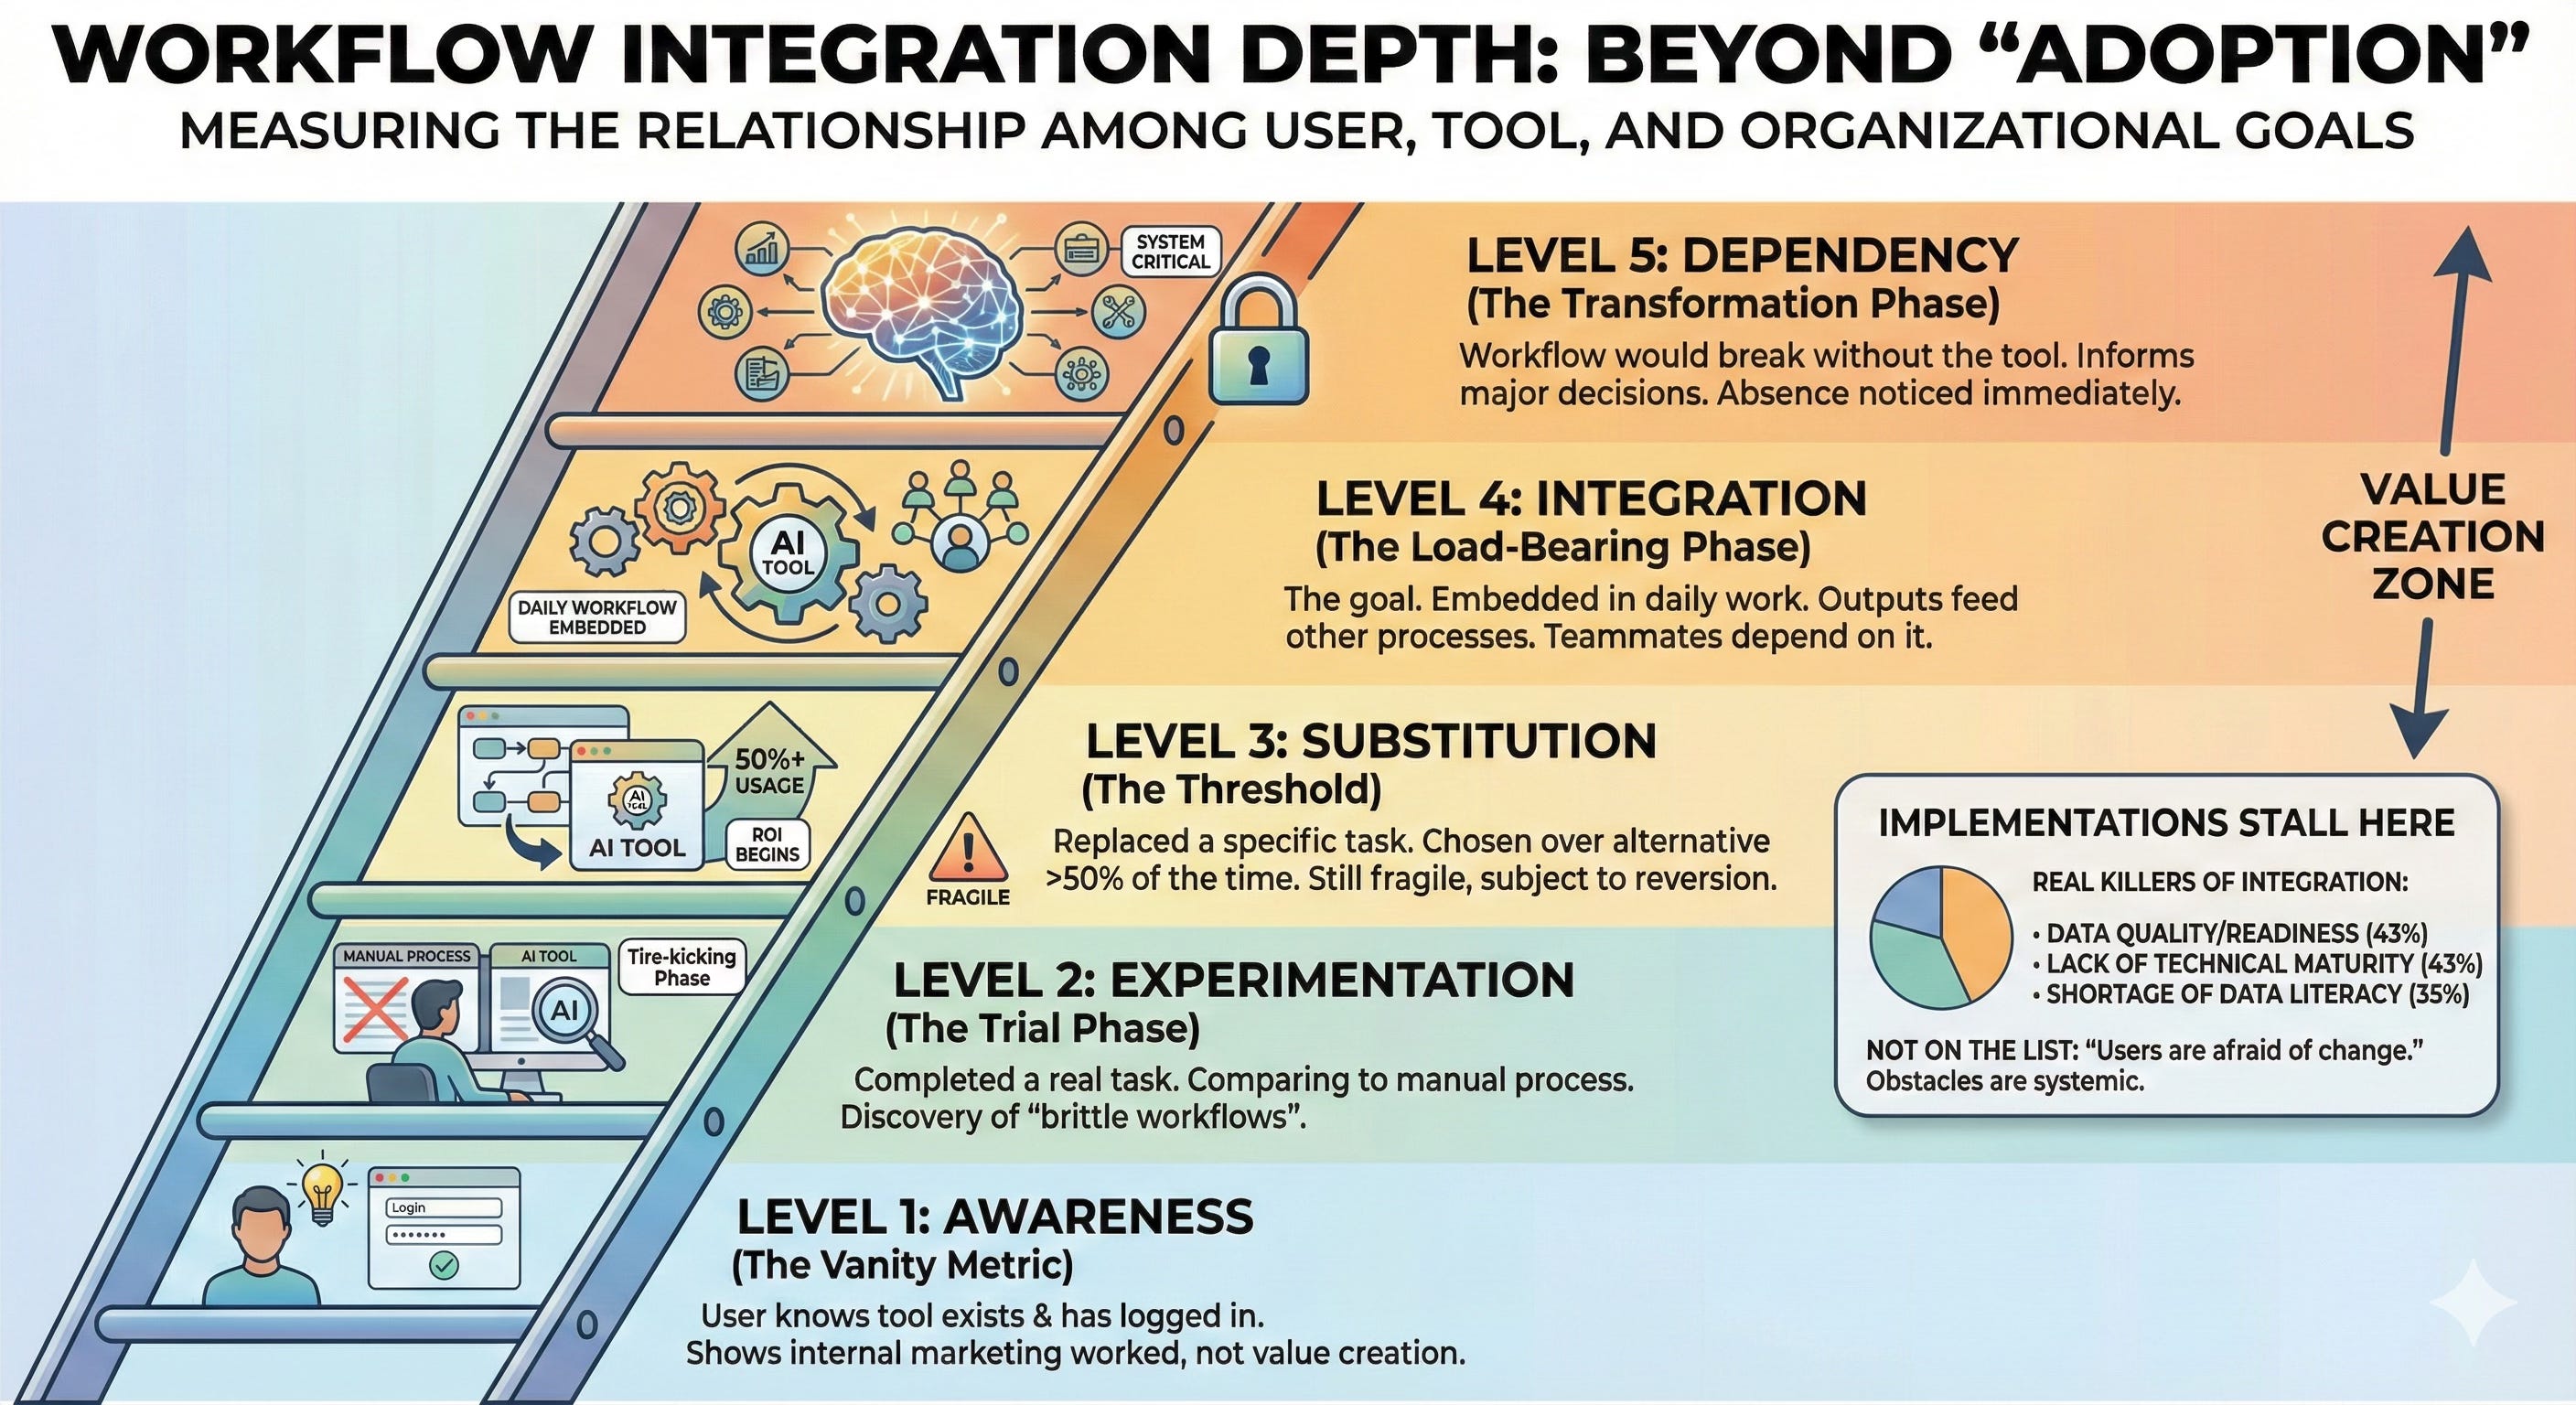
Level 1: Awareness (The Vanity Metric)
The user knows the tool exists and has logged in. This is where most “adoption” reporting stops. It tells you that your internal marketing worked, but nothing about whether value is being created.
Level 2: Experimentation (The Trial Phase)
The user has completed a real task with the tool and compared it to their manual process. This is the “tire-kicking” phase. Most pilots live here. It’s also where “brittle workflows” (as MIT NANDA researchers call them) are discovered. If the tool is clunky here, the user votes “No” and goes back to their old way.
Level 3: Substitution (The Threshold)
The tool has replaced a specific manual task and is chosen over the alternative more than 50% of the time. This is where the ROI begins to materialize. However, it’s still fragile. If the system goes down or the data quality dips, the user will revert to the manual process immediately.
Level 4: Integration (The Load-Bearing Phase)
This is the goal. The tool is embedded in the daily workflow. Its outputs feed other processes. Teammates depend on those outputs. At this level, the tool is no longer an “AI project”—it’s just “how we do the work.” The workflow has been redesigned around the tool’s presence.
Level 5: Dependency (The Transformation Phase)
The workflow would break without the tool. It informs decisions that go beyond the original scope. People would notice its absence as quickly as they’d notice if email or Slack went down.
Most “adopted” enterprise AI tools sit at Level 1 or 2. The ones that actually move the needle for the business reach Level 4 or 5.
The reason implementations stall at the lower levels isn’t usually a lack of “innovation” from the users. Informatica’s CDO research identified the real killers: data quality/readiness (43%), lack of technical maturity (43%), and a shortage of data literacy (35%). Notice what isn’t on that list: “users are afraid of change.” The obstacles are systemic. Users want to move to Level 4, but the data is too messy, or the process is too rigid to allow them.
What to Actually Track
Moving from “logins” to “integration depth” requires a different set of questions. If you are a product manager or a data leader, these are the metrics that actually matter:
Task Completion Rate (The “No Fallback” Metric): What percentage of AI-assisted tasks are completed entirely within the tool? If users start in the AI tool but finish the task manually because the export function is broken or the output is unreliable, your integration depth is zero.
Output Utilization Rate: What percentage of AI outputs are used with minimal modification? If your team is “using” AI but then spending hours rewriting the results, you haven’t saved time—you’ve just changed the nature of the labor.
Workflow Chain Length: How many downstream processes depend on the AI’s output? If the output of your AI tool ends up as a PDF on one person’s hard drive, it hasn’t been integrated. If that output feeds a dashboard that three other teams use to make decisions, you’ve reached Level 4.
Return Frequency per Task Type: Don’t look at “daily active users.” Look at “repeat usage for task X.” One-time use is an experiment. Using it every Tuesday for the same report is a substitution.
Team Propagation: Has usage spread organically from the “power user” to the rest of the team? Integration is social. If the tool isn’t being shared or used collaboratively, it’s a personal hack, not an enterprise product.
These metrics are harder to measure. They require you to instrument the workflow, not just the application. But the easy metrics are lying to you. They are telling you a story of success while your project is quietly being sidelined.
Your Real Job
The adoption curve gave us the luxury of patience. We could tell ourselves, “We’re just in the early adopter phase; the majority will catch up eventually.” It allowed us to wait for a wave that never actually came.
Gartner predicts that 30% of GenAI projects will be abandoned by the end of 2025. This won’t happen because the models aren’t smart enough. It will happen because the workflows have never been updated to accommodate them.
As a leader in this space, your job isn’t to drive “adoption.” That’s a marketing goal. Your job is to drive integration.
Stop celebrating pilot completions. A pilot that doesn’t move to production isn’t a success; it’s an expensive lesson in friction.
Stop counting users. Count the tasks that would break if you turned the tool off. A team of five users at Level 4 (Integration) is more valuable to the business than five hundred users at Level 1 (Awareness).
Stop asking “Did they adopt?” Ask “Did they integrate?”
Low adoption suggests you need better training or better internal PR. Low integration suggests a product problem—the tool doesn’t fit the reality of the work.
The organizations that win with AI won’t be the ones with the highest license counts. They will be the ones where AI has become invisible—so deeply embedded in the “daily vote” that people forget they’re even using it.
That’s not an S-curve. That’s a fundamental shift in the architecture of work. And your job is to make that shift inevitable.
Thanks for reading! Subscribe for free to receive new posts and support my work.